AudioPlot is an experiment\prototype I created to help Felipe, a blind student in our quantum information research group. Many concepts in mathematics are very visual, and many ideas require plots and diagrams to explain. How can visually-impaired or blind STEM students circumvent these limitations?
I figured perhaps we could "plot" functions by using sound? Couldn't intuition about shapes and curvature be conveyed using variations in sound pitch, volume and so forth? It turns out this wasn't a completely novel idea, although my implementation of it was very different from what's been done before.
Experiments with him were successful, and he was able to identify and even predict the sound of several functions. It took about 30 minutes to gain a relatively good intuition for functions.
A surprising thing I discovered after playing with the prototype for a few hours is that function composition, product and addition also "make sense" in audio form.
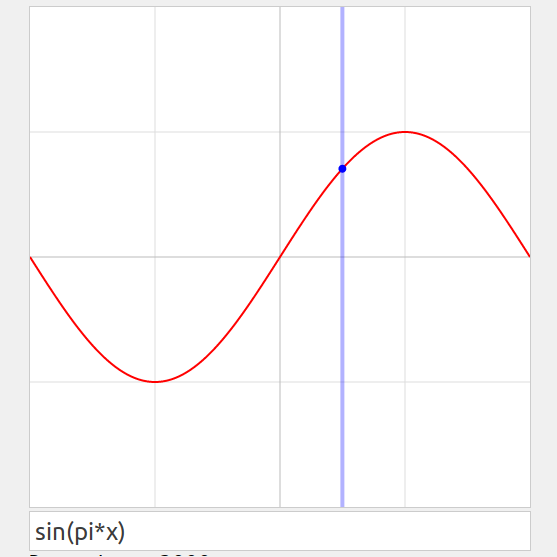
The very simple interface of AudioPlot. An input box allows the user to type out a function to be "audiplotted". Keyboard commands allow for changing the sound generation parameters.
Note: the AudioPlot prototype is not fully accessible and screen-reader compatible. The goal was to try it out together with Felipe to see if the idea is feasible. Desktop compatible only. Google Chrome browser is recommended, but it should work fine on Firefox.
A future experiment is to use timbre and binaural\3D audio to ehance the experience, and perhaps even create "3D audio plots" with multiple audio layers. Humans are very good at distinguishing a superposition of timbres: we can focus on a clarinet, trumpet, guitar or voice individually. We can even distinguish between different voices talking over one another. This is a very powerful ability! In a future experiment, I plan to see if a sound landscape of multiple timbres with simulated 3D positions can be used to convey a 3D "audio surface". It's certainly worth a shot!
The use of headphones is required for the full effect. A few points regarding my implementation:
- The pitch at y=0 is softly playing constantly in the background as a sine wave, to act as a reference pitch.
- The function is "plotted" as a square wave, so the various harmonics make it more distinct from the reference pitch.
- The x range is from -1 to +1, and the y range from -2 to +2 by default. This window could be configured beforehand in a more advanced application.
- Left\right stereo is correlated to the cursor position. (Ideally, this would use binaural audio to simulate a virtual 3D position.)
- The -1, -1/2, 0, +1/2 and +1 positions include soft and hard noise "beat". This makes every function almost a little melody with a specific rhythm. Translated functions like sine and cosine become very distinct rhythms, and each end up having their own "feel".
- The pause between loops can be shortened and increased. Depending on the function and its symmetry, this pause seems to make a big difference.
- The pitch range can be adjusted in real time. It seems that a vertical span of 4 octaves is a good range.
- The time position can be changed manually, allowing the user to "walk" around the function.
- The speed of playback can be changed. This is very important for more complex functions. The "beats" help immensely with positioning\location in this regard.
Overall, it was a very interesting experiment and it's certainly something I'll be exploring more in the future!